IC Markets Home Sign in Web Trader Contact Us
IC Markets Social IC Markets Social

Information Hub for
Serious Traders

  • ABOUT US
  • OPEN LIVE ACCOUNT
  • OPEN DEMO ACCOUNT
  • TRADE NOW
  • VISIT OUR BLOG
IC Markets Social
  • ABOUT US
  • OPEN LIVE ACCOUNT
  • OPEN DEMO ACCOUNT
  • TRADE NOW
  • VISIT OUR BLOG
March 1, 2022North_American_Stocks_esIC Markets

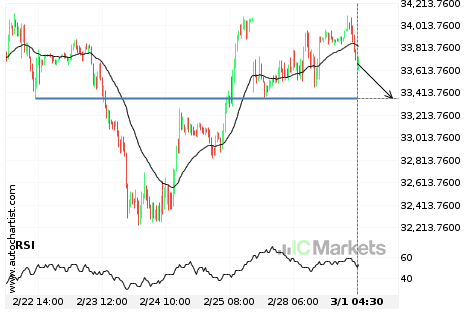
Un posible impulso final en el US Wall Street 30 Index

El US Wall Street 30 Index avanza hacia 33360.8984 y podría alcanzar este punto en un plazo de 2 días. Ha probado esta línea previamente en numerosas ocasiones y esta vez no tiene porqué ser diferente, terminando con una recuperación en lugar de en una rotura. Si la rotura no ocurre, podríamos observar un retroceso […]

Read more
February 28, 2022North_American_Stocks_esIC Markets

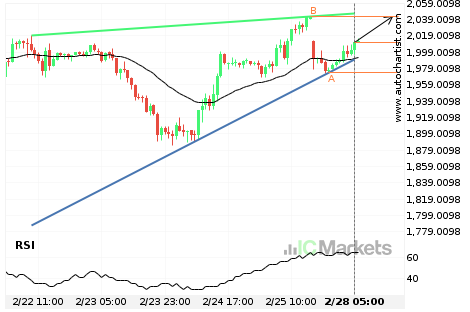
US Small Cap 2000 Index – acercándose a la resistencia del Cuña ascendente

El US Small Cap 2000 Index avanza hacia una línea de resistencia. Como le hemos visto retroceder desde esta línea anteriormente, podríamos presenciar, o bien, una ruptura a través de esta línea o una recuperación a los niveles actuales. Ha llegado a esta línea en numerosas ocasiones en los últimos 6 días y puede probarla […]

Read more
February 25, 2022North_American_Stocks_esIC Markets

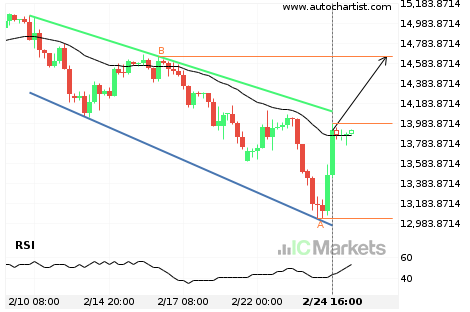
El US Tech 100 Index se aproxima a la resistencia de un Canal bajista

El US Tech 100 Index se está acercando a la línea de resistencia de un Canal bajista. Ha llegado a esta línea en numerosas ocasiones durante los últimos 15 días. Si vuelve a probarla de nuevo, debería hacerlo en las próximas 3 días.

Read more
February 24, 2022North_American_Stocks_esIC Markets

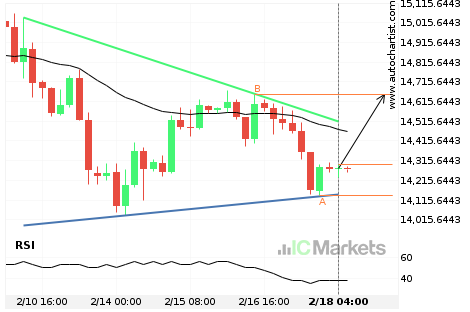
El US Small Cap 2000 Index se aproxima a el soporte de un Cuña descendente

El US Small Cap 2000 Index se está acercando a la línea de soporte de un Cuña descendente. Ha llegado a esta línea en numerosas ocasiones durante los últimos 2 días. Si vuelve a probarla de nuevo, debería hacerlo en las próximas 12 horas.

Read more
February 23, 2022North_American_Stocks_esIC Markets

Un posible comienzo de una tendencia alcista en el US SPX 500 Index

El US SPX 500 Index ha atravesado una línea de resistencia de un patrón de gráfico que corresponde a un Triángulo. Si esta irrupción se mantiene, podríamos ver el precio del US SPX 500 Index probando el nivel de 4378.2253 dentro de las próximas 13 horas. Pero no se apresure si desea operar, porque ya […]

Read more
February 22, 2022North_American_Stocks_esIC Markets

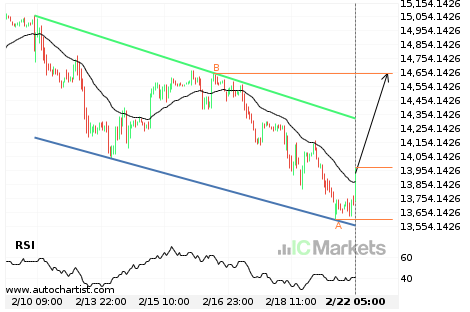
US Tech 100 Index – acercándose a la resistencia del Canal bajista

El US Tech 100 Index avanza hacia una línea de resistencia. Como le hemos visto retroceder desde esta línea anteriormente, podríamos presenciar, o bien, una ruptura a través de esta línea o una recuperación a los niveles actuales. Ha llegado a esta línea en numerosas ocasiones en los últimos 12 días y puede probarla de […]

Read more
February 21, 2022North_American_Stocks_esIC Markets

¿Tendrá el Amazon.Com Inc. suficiente impulso como para irrumpir el soporte?

El Amazon.Com Inc. se dirige hacia la línea de soporte de un Canal bajista y puede alcanzar este punto en las próximas 5 horas. Ha probado esta línea ya en numerosas ocasiones en el pasado, y esta vez no tendría porqué ser diferente y terminar con una recuperación en lugar de una irrupción. Si ésta […]

Read more
February 18, 2022North_American_Stocks_esIC Markets

US Tech 100 Index – acercándose a la resistencia del Triángulo

El US Tech 100 Index avanza hacia una línea de resistencia. Como le hemos visto retroceder desde esta línea anteriormente, podríamos presenciar, o bien, una ruptura a través de esta línea o una recuperación a los niveles actuales. Ha llegado a esta línea en numerosas ocasiones en los últimos 8 días y puede probarla de […]

Read more
February 17, 2022North_American_Stocks_esIC Markets

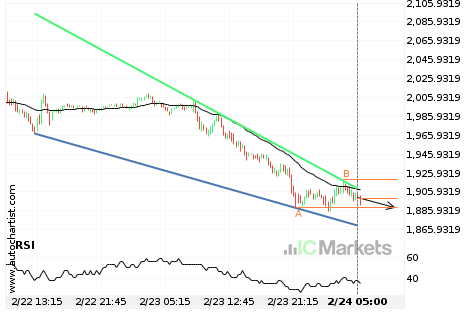
US SPX 500 Index – acercándose a el soporte del Cuña descendente

El US SPX 500 Index avanza hacia una línea de soporte. Como le hemos visto retroceder desde esta línea anteriormente, podríamos presenciar, o bien, una ruptura a través de esta línea o una recuperación a los niveles actuales. Ha llegado a esta línea en numerosas ocasiones en los últimos 13 días y puede probarla de […]

Read more
February 16, 2022North_American_Stocks_esIC Markets

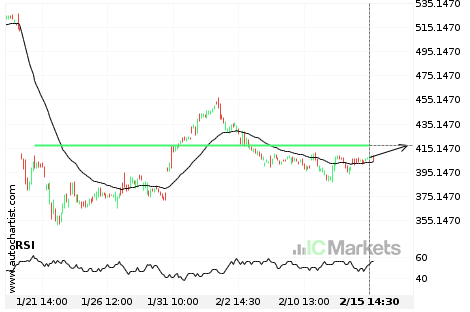
O bien, una inminente recuperación o una ruptura del Netflix Inc.

El Netflix Inc. avanza hacia la línea de 417.3000. Si este movimiento se mantiene, el precio del Netflix Inc. podría probar el nivel de 417.3000 en un plazo de 21 horas. Pero no se apresure a la hora de operar, porque el par ha probado esta línea en numerosas ocasiones durante el pasado, por lo […]

Read more
  • 1
  • 2
  • 3
  • …
  • 63
  • 64
  • 65
  • 66
  • 67
  • 68
  • 69
  • …
  • 89
  • 90
  • 91

Recent Posts

  • Either a rebound or a breakout imminent on SILVER
  • GOLD Nível visado: 2976.3601
  • A potential bearish movement on GOLD
  • มีโอกาสเกิดการเคลื่อนตัวแบบ bearish บน GOLD
  • Posible gran movimiento en el AUDJPY

Recent Comments

    Translation


     Edit Translation

    Trade with

    a market leader you can rely on

    Open Trading Account Try a Free Demo

    Forex Trading

    • Accounts Overview
    • Open an Account
    • Launch Web Trader

    Trading Specifications

    • Spreads and Commissions
    • Range of Market
    • Trading Hours
    • Funding
    • Withdrawal

    About IC Markets

    • Help Center
    • Why IC Markets
    • Regulation
    • Legal Documents
    • Contact Us


    Forex Trading

    • Accounts Overview
    • Open an Account
    • Launch Web Trader

    Trading Specifications

    • Spreads and Commissions
    • Range of Market
    • Trading Hours
    • Funding
    • Withdrawal

    About IC Markets

    • Chat with a Specialist 24/7
    • Why IC Markets
    • Regulation
    • Legal Documents
    • Contact Us

    Disclaimer: This material is marketing material where all marketing material is published for informational purposes only. This material does not contain and should not be considered as containing - investment advice and recommendations, or suggestions for performing any actions with financial instruments. The built-in widgets belong to their external independent authors, and IC Markets is not responsible for their content and their impact on trade.

    All content rights reserved. Opinions of the authors may not coincide with the opinion of the blog editors. When copying materials from this site or connecting to an RSS feed to republish our articles, a link to IC Markets or attribution in the format ‘IC Markets Blog’ is required. For general questions, please contact the editorial office via the form on the Contact us page.

    Risk Warning: Trading Derivatives carries a high level of risk to your capital and you should only trade with money you can afford to lose. Trading Derivatives may not be suitable for all investors, so please ensure that you fully understand the risks involved and seek independent advice if necessary. A Product Disclosure Statement (PDS) should be considered before entering into a transaction with us.

    The contents of this page are general information only and does not take into account your personal situation, financial objectives or needs. It is up to you to make sure the products that we offer suit your specific needs. You should not trade with us unless you understand the features and risks of the products that we offer. This means that you might need to seek independent advice before you start trading with us.

    © 2022 Raw Trading Ltd | All rights reserved.
    • Sample Page